With the Line Segment tools are two other tools that can be used to create graph-like shapes. These are the Rectangular Grid tool and the Polar Grid tool which you can use to emulate other types of graphs. Refer to Figure 6-23.
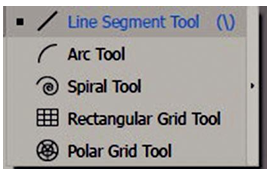
Figure 6-23. Toolbars’ panel with various line drawing options
The Rectangular Grid tool could be used to create a waffle graph/chart. The Polar Grid tool could be used to create a type of unique pie chart, radar graph, or org chart. If you use either of these tools just for design, you can drag out a shape while holding down the Shift key to create a proportionate shape or click the artboard first or double-click the tool to access the dialog box. Make sure to press your D key if you need to reset your stroke and fill. Refer to Figure 6-24.
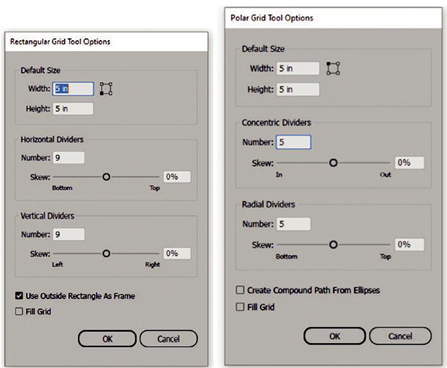
Figure 6-24. Rectangular Grid Tool Options and Polar Grid Tool Options panel
The rectangular grid by default is a series of grouped lines. Refer to Figure 6-25.
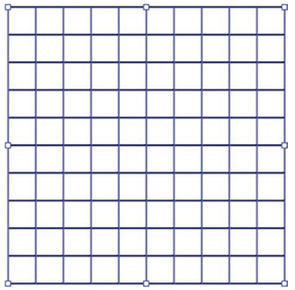
Figure 6-25. A rectangular grid on the artboard
Using the dialog box, you can set the default width, height, and the reference point from which it is dragged out. You can also set the number of horizontal and vertical dividers (0–999) as well as the skew percentage (-500, 0, 500%). For horizontal, set the range from bottom to top or vertical, left to right using the sliders. You can also enable the setting Use Outside Rectangle As Frame and the option to fill the grid though you can leave this setting disabled. Refer to Figure 6-26.
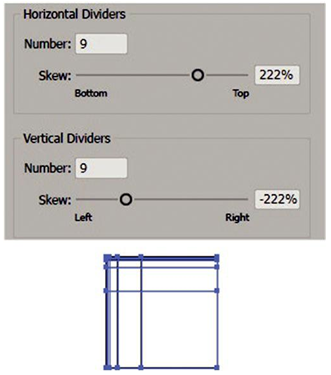
Figure 6-26. Rectangular Grid Tool Options dialog box settings and the grid skewed on the artboard
In the case of the waffle graph/chart, you would need to set your shape as a square, for example, 5 inches for both width and height, if you consider each block to be 1%. To create a 10 by 10 to create 100%, you would need to set the number dividers to 9 each and skew to 0% and the “Use Outside Rectangle As Frame” enabled and leave “Fill Grid” disabled. Upon clicking OK, this would create the grid or the chart you require. However, I would not fill in the squares themselves using the “Fill Grid” option as that would fill all the squares or create 100%. Later in Chapter 8, you will look at the Live Paint tool which will help you complete the waffle chart. Refer to Figure 6-24.
For the Polar Grid Tool dialog box, you can also enter similar settings, but this time for arc lines. Refer to Figure 6-24 and Figure 6-27.
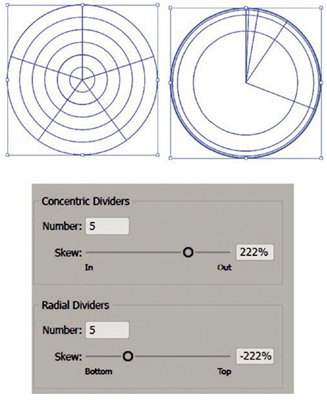
Figure 6-27. Polar Grid normal and skewed with Polar Grid Tool Option dialog box settings
This includes the width, height, and the reference point from which it is dragged out. You can also set the number of concentric and radial dividers (0–999), as well as the skew percent (-500, 0, 500%). For concentric dividers, set the range from in to out or radial dividers, bottom to top using the sliders. You can also enable the settings Create Compound path from ellipses and the option to fill the grid though you can leave these settings disabled for now. As you will see later in Chapter 8, a Polar Grid can also be used with the Live Paint tool.